
Sixty-two per cent of households waiting need a one-bedroom home. Only 5.6% of Broadland's homes have one bedroom. Cabinet sees the evidence on 15 September.
There are 1,043 households on Broadland’s housing register, and 62 per cent of them are waiting for a one-bedroom home. Just 5.6 per cent of the district’s homes have one bedroom.
That mismatch is the finding at the centre of a housing evidence base that Broadland District Council publishes this week, ahead of a Cabinet meeting on Tuesday 15 September. Cabinet is asked to send the draft Broadland Housing Strategy 2027 to 2030 and its supporting evidence out to public consultation (Cabinet agenda, 15 September 2026).
The evidence base is unusually blunt about the district it describes. It opens by noting that Broadland “is often perceived as a district with low deprivation, characterised by an older population, predominantly living alone in detached, mortgage-free homes with at least one spare bedroom”, then sets out why that picture is incomplete (Housing Strategy Evidence Base, August 2026).
The gap between what is needed and what gets built
Broadland’s housing register grew by 11 per cent in eight months to July 2026. The need on it is overwhelmingly for the smallest homes:
- 62% of households on the register need a one-bedroom home
- 23% need two bedrooms, 12% need three and 3% need four
- 93% of those with a one-bedroom need are single people
- Of those single applicants, 27% are aged 25 or under, 59% are 25 to 65 and 14% are 66 or over
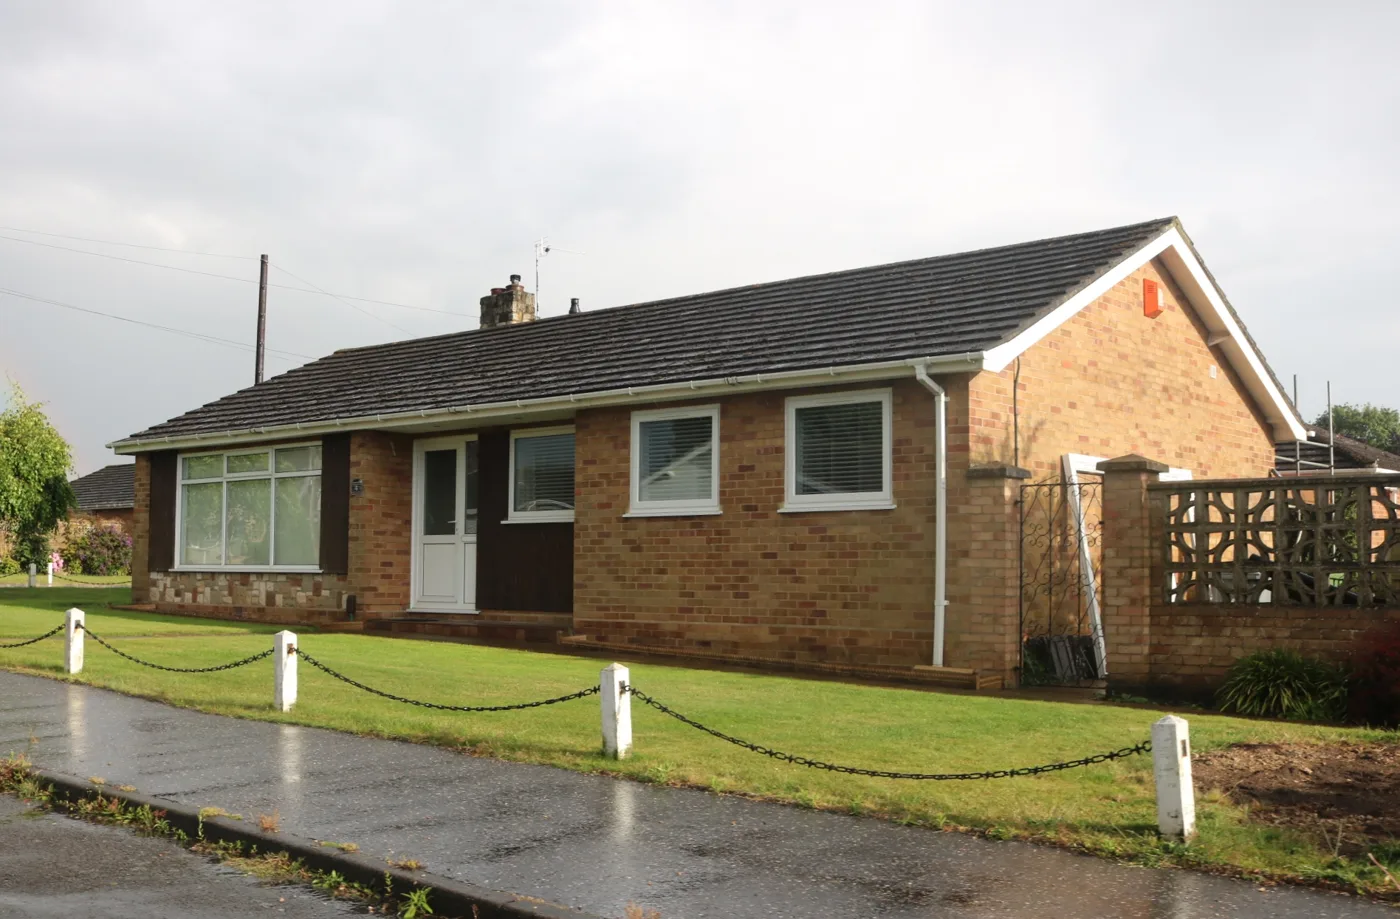
The district’s homes point the other way. Bungalows are the most common dwelling type at 31 per cent, followed by detached houses at 28 per cent and semi-detached at 21 per cent. Terraced homes make up 13 per cent and flats 5 per cent. By size, 43.7 per cent of Broadland homes have three bedrooms and 26.5 per cent have four or more, both above the Norfolk and England averages.
New building has not closed the gap. Across 2023/24 to 2025/26, an average of 6 per cent of all new homes completed in the district were one-bed, against 44 per cent three-bed and 30 per cent four-bed or bigger.
The affordable programme has skewed harder towards small homes than the open market. Of affordable homes completed between April 2023 and March 2026, 34 per cent were one-bed. In raw numbers that came to 126 new social rent one-bedroom homes, against demand from nearly 650 households on the register.
Modelling done in 2025 puts the requirement at 1,791 social homes over five years, of which 1,147, or 64 per cent, need one bedroom.
Nearly 37,000 spare bedrooms
The other half of the picture is under-occupation, and the council has put a number on it.
Ninety per cent of owner-occupied homes in Broadland have one or more surplus bedrooms, against 69 per cent of privately rented homes and 37 per cent of socially rented ones. Counting every bedroom in the district, the evidence base estimates there is a bedroom available for every single resident, with a surplus of just under 37,000 bedrooms.
Over-occupation, where a household has fewer bedrooms than it needs, runs at 4 per cent in social rented homes, 2 per cent in private rented and 1 per cent among owner occupiers.
Homelessness has risen 81% in three years
The register is only part of the demand. Broadland recorded 483 homelessness presentations in 2024/25, against 267 in 2021/22, a rise of 81 per cent.
Households in temporary accommodation have gone from 44 in April 2022 to 118 in June 2026, and 74 per cent of them are single households. In 2025/26, 92 of the district’s one-bedroom social rent homes, 47 per cent of the total let, went to households in temporary accommodation.
The reasons people lose their homes are recorded too. Between April and October 2025 the most common trigger for a prevention duty was the end of a private rented tenancy, at 34.7 per cent, followed by family no longer willing to accommodate, at 29.3 per cent. Households fleeing domestic abuse made up a quarter of all homelessness applications in that six-month period.
Renting costs more here than the Norfolk average
Private rents in Broadland have risen by an average of 65 per cent between 2015 and May 2026. The average rent is now £939 a month, and the district is more expensive than Norfolk as a whole:
| Size | Average monthly rent | Gap to Local Housing Allowance |
|---|---|---|
| One bedroom | £692 | £103.62 |
| Two bedrooms | £894 | £200.88 |
| Three bedrooms | £1,079 | £281.19 |
| Four bedrooms | £1,550 | £403.14 |
That right-hand column is the shortfall a household on housing benefit has to find from the rest of its income every month, because Local Housing Allowance no longer reaches the market rent.
Buying is not easier. The average house price in the district is £313,000, about 8.2 times the average salary, and the second highest in Norfolk. A first-time buyer home averages £270,000. Saving £250 a month at 3 per cent interest, the evidence base calculates it would take eight years to raise a 10 per cent deposit, or fourteen years and five months for 20 per cent.
The condition of the homes that already exist
Government stock condition modelling from 2024, quoted in the evidence base, puts 16 to 20 per cent of Broadland’s private rented homes below the Decent Homes Standard, against less than 8 per cent of social rented homes. Between 8 and 12 per cent of private rented homes carry a Category 1 hazard, meaning a serious and immediate risk to the health or safety of the people living there.
On energy, 55 per cent of the district’s 42,784 assessed homes are rated EPC D to G, and the average rating is a D. 8.6 per cent of Broadland households were in fuel poverty in 2024. There were 127 very long-term empty homes in the district as of June 2026, on which the council tax empty homes premium applies.
The least deprived district in Norfolk, and the housing barriers
One line in the demographic appendix explains why this story is easy to miss.
On the 2025 Indices of Multiple Deprivation, Broadland ranks 240th out of 296 local authority areas, putting it in the least deprived fifth of England and making it the least deprived district in Norfolk. On the Barriers to Housing and Services measure alone, it ranks in the 40 per cent most deprived.
The district is also ageing faster than the country. Its median age is 48, against 40 for England. Just over a quarter of residents are over 65, against 18.7 per cent nationally, and the over-65 population grew by more than 22 per cent between 2011 and 2021 while the working-age population grew by less than 1 per cent.
What the strategy proposes to do
The draft strategy runs from 2027 to 2030 and is built on three themes: enabling the right homes in the right places, improving the quality and sustainability of existing homes, and supporting residents to live safely and independently in homes that meet their needs.
Its main new mechanism is a Housing Intelligence Hub, a single platform pulling together data from planning, housing enabling, homelessness, environmental health and benefits, so the council can intervene earlier and negotiate harder with developers.
A housing strategy is not a statutory document. The report is candid about why the council wants one anyway: it can be used as supporting evidence in planning objections and appeals, and it would “retain local knowledge, conserving the identity of Broadland and its distinct communities in the area for the period post-LGR”, a reference to local government reorganisation. An LGA peer review of the council’s housing services in June 2026 recommended a housing strategy explicitly (Cabinet report, 15 September 2026).
There is a planning consequence running underneath all of it. The Greater Norwich Land Supply Assessment of 2025 puts the area’s housing land supply at 4.85 years, below the five-year threshold. As we reported when three schemes went to the planning committee this month, that shortfall is the reason officers keep recommending approval for sites outside settlement boundaries.
What it means for you
If Cabinet agrees on 15 September, the draft goes out to consultation through workshops with landlords, developers, registered providers and voluntary sector organisations, and through an open public survey. The report does not give the dates. It says the strategy will then be finalised, with an action plan, and put to Full Council for approval.
The meeting is at 6pm on Tuesday 15 September at the Horizon Centre, Peachman Way, Norwich NR7 0WF, and Cabinet agendas carry a public speaking slot. The agenda and the full reports pack are on the council’s meetings site.
If you are on the housing register, the numbers above are the honest answer to why the wait is long: the homes most people are waiting for are the ones Broadland has fewest of, and builds fewest of. If you rent privately, the Local Housing Allowance gap in the table is the figure to check against your own rent before the Renters’ Rights Act changes land.
Our related pages: Broadland house prices, council tax bands and planning applications.
Sources
- Broadland Cabinet agenda, Tuesday 15 September 2026, for the meeting, venue and item list.
- Broadland Housing Strategy: Consultation Draft, Cabinet report, report author Victoria Parsons, Housing and Communities Strategy Manager, for the recommendation, the consultation method, the LGA peer review and the legal position.
- Appendix 1: Broadland Housing Strategy 2027 to 2030, consultation draft, for the three themes, the Housing Intelligence Hub and the 126 one-bed social rent homes against nearly 650 households in need.
- Appendix 2: Broadland Housing Strategy Evidence Base, August 2026, for the housing register, tenure and bedroom figures, under-occupation, homelessness and temporary accommodation, rents and the Local Housing Allowance gap, house prices and deposits, stock condition, energy ratings, empty homes, the land supply figure and the demographic appendix.
Have your say